Soccermatics: How maths will change your understanding of football
Science is playing an ever bigger part in football. Professor David Sumpter shows you how maths is influencing the game by examining Manchester United and Arsenal's passing patterns...
Maths professor and Stats Zone user David Sumpter begins a series of articles for FourFourTwo using mathematics to analyse football, ahead of next summer's release of his book Soccermatics. Here's his first report, as he looks at the difference between Manchester United and Arsenal's passing...
Numbers are revolutionising football. Every match provides stats about a player's pass-completion rate, distance run and shot conversion. Fantasy football leagues assign points to players for goals scored, appearances and assists. On betting sites, teams are characterised by their number of shots, corners and possession.
But to really understand numbers we need ways of visualising them. We need more than a list of players’ and teams’ vital statistics. We need to reveal the team’s inner workings and its structure. And this requires a whole new way of seeing football. It requires what this writer calls Soccermatics.
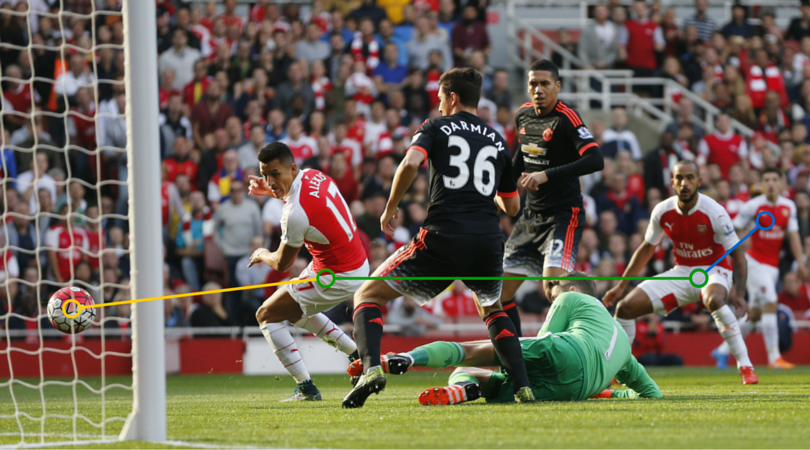
Mata's magical goal
In a series of articles for FourFourTwo, David Sumpter will be looking at new ways of using Stats Zone data to understand tactics and team performance.
We are now used to the detailed, on-the-ball data presented on the Stats Zone website, using information provided by Opta. Sometimes this data can really get to the heart of how a team is playing. For example, in the image below we see the sequence of passes leading to Juan Mata’s third goal against Southampton last month. The arrows show the amazing 45 passes, switching between both wings, that were part of the build-up to the goal.
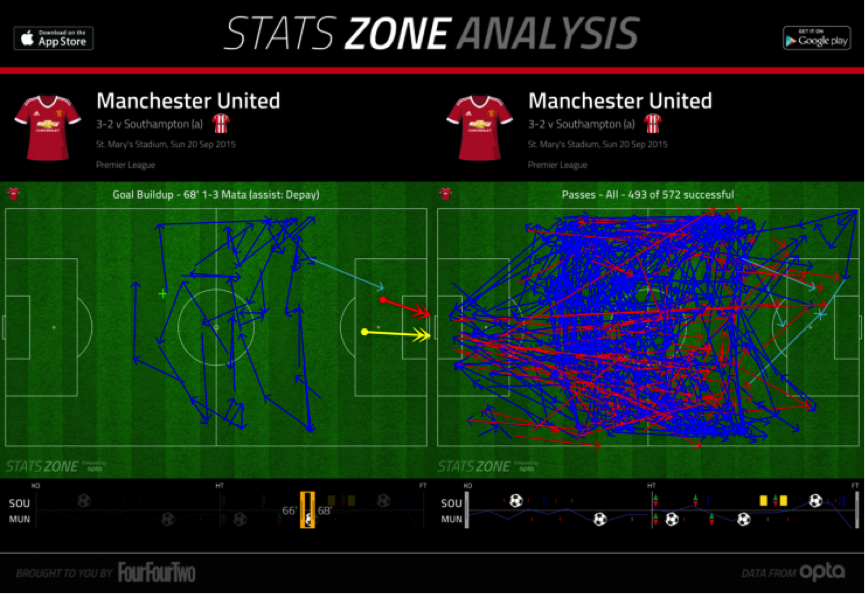
At other times, however, Stats Zone’s arrows are more difficult to understand. In the screenshot above we also see all of the 572 passes made. The only thing we can really take away from this tangled mess is that United pass a lot. What is actually going on tactically with these passes is more difficult to make out.
The best features, fun and footballing quizzes, straight to your inbox every week.
To understand how different teams pass the ball we can create a distribution map. This is pictured below, using Opta data, showing Manchester United’s passing patterns during the entire 2014/15 season.
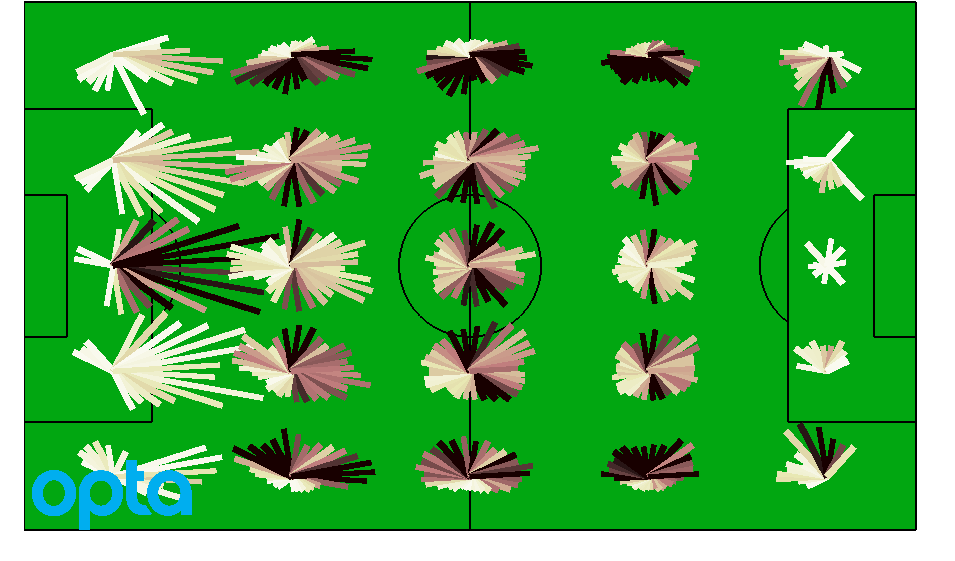
It takes a little thought to understand the distribution map, but once you have got it then it provides a deep insight in to how Louis van Gaal had his team playing over the entire season.
The pitch above has been divided into 25 equally sized areas. Each of the lines out of the middle of the areas shows the direction passes were made at that part of the pitch. Longer lines mean longer passes. So the lines are longer in United’s half (on the left) as the ball is passed up the pitch, but are shorter in the opponents' half of the pitch.
The colour of the lines is also important. Black means that a pass is relatively common and white means it happens less often. Brown is somewhere in between. As we might expect, passes inside the opponent’s box are uncommon, since here a shot is in order. But other details tell us about the teams' tactics.
Using the wings
For example, United made lots of passes both out to the wings and then back from the wings into the area in front of the box. Looking again at the Mata goal against Southampton, we can now see that it was a perfect execution of an idea that Van Gaal had built on throughout 2014/15: rapid movement of the ball between the wings to unbalance the opposition, followed by a penetrating move into the box. The tactic was in the data, we just need to build the right map in order to lift it out.
The distribution map allows us to quickly characterise a team. Van Gaal got very upset back in February when he was accused of playing a long ball game, grabbing a Stats Zone-style print-out to show how his team passed.
A good contrast here is with Arsenal, who are widely celebrated for their short, sharp and skilful passing. Below is the same type of distribution map for Arsenal from last season.
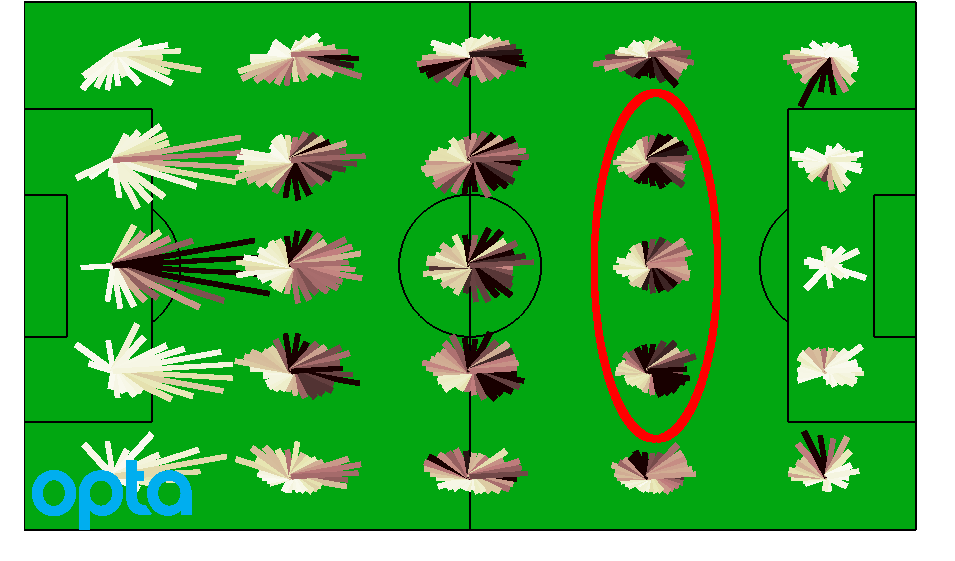
Arsenal’s passes are indeed shorter than United’s. Secondly, Arsenal concentrate their passes in the area in front of the box
Looking carefully at the teams’ distribution maps reveals two important differences. Firstly, Arsenal’s passes are indeed shorter than United’s. Secondly, Arsenal concentrate their passes in the area in front of the box. Arsenal make a lot more passes within the region marked by the red circle than United do.
Passing in front of the box to generate chances is a characteristic style of Wenger’s recent teams and we saw it to great effect against Manchester United. Moving back to Stats Zone, below you'll see Arsenal’s final-third passes during their 15-minute goal spree in the 3-0 victory at the Emirates.
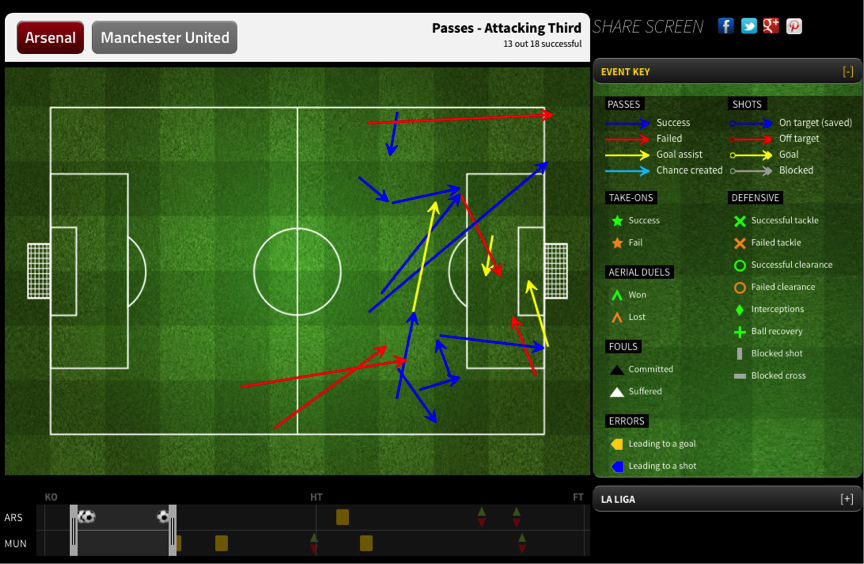
The ball zings around in front of and inside the box, before a shot comes from close range. This is the perfect execution of the technique Arsenal have developed over the last few years.
While Van Gaal differs tactically from Wengar, the term ‘long ball’ to describe his style of play is misleading. United do make longer passes, but they pass further because they build up from the wings, instead of in the centre.
Long ball game?
In total, United completed more passes than Arsenal in the Premier League last season. So rather than playing the long-ball, route one football associated with Wimbledon in the 1990s, United have found a new style of long pass possession football.
Liverpool, Southampton and Sunderland had difficulty coping with United’s passing last month. For their part, Manchester United had difficulty coping when Arsenal came directly forward early on. It is early days in the season and it will be interesting to see which team and which tactic prevails.
The distribution map is just one way of visualising data we'll be looking at in the coming months. Passing networks, zonal networks, defensive hulls and shot distributions are other tools we can use to get to the bottom of tactics. Numbers and statistics are interesting, but to get real understanding we need Soccermatics.
- Look out for Professor David Sumpter's next analysis coming soon on FourFourTwo.com, where he'll dissect more team's passing patterns and how to influence a match specifically by using maths
 Join The Club


