


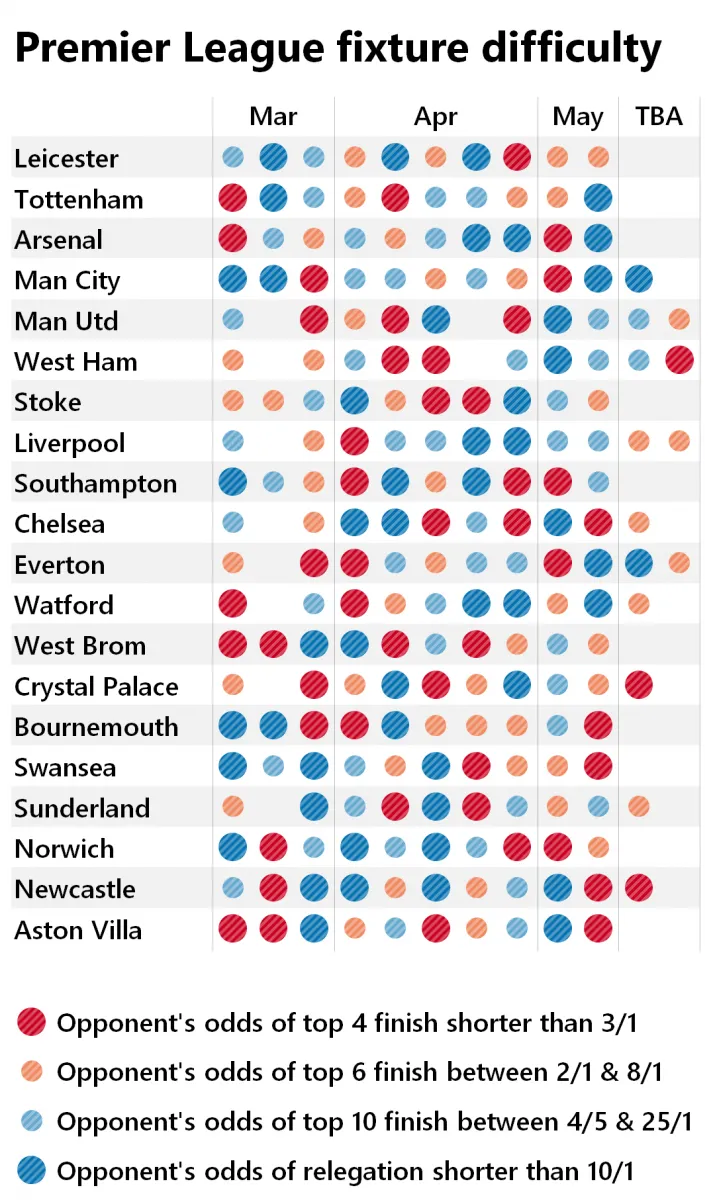
Does your side have a nice, gentle end to the season or are there some landmines awaiting in what’s left of the fixture calendar? This infographic plots the difficulty of each Premier League club’s remaining games, starting with this weekend.
We've taken an average of the leading bookmakers’ current odds to divide the top flight into five groups of four, based on their strength, and then visualised them via a basic traffic light system. The big red circles are the games best watched through your fingers, but get the beers in for the big blue ones...
There are a few matches that got postponed due to cup ties and haven’t been rescheduled yet: these are stuck under “TBA” on the right for now, but we’ll update this graphic once they’ve been given a new date.

Last PL fixtures
Saturday March 5
Tottenham v Arsenal
Chelsea v Stoke
Everton v West Ham
Man City v Aston Villa
Newcastle v Bournemouth
Southampton v Sunderland
Swansea v Norwich
Watford v Leicester
Sunday March 6
Crystal Palace v Liverpool
West Brom v Man Utd
Saturday March 12
Norwich v Man City
Bournemouth v Swansea
Stoke v Southampton
Sunderland v Everton
West Ham v Watford
Arsenal v West Brom
Sunday March 13
Aston Villa v Tottenham
Monday March 14
Leicester v Newcastle
Saturday March 19
Everton v Arsenal
Chelsea v West Ham
Crystal Palace v Leicester
Watford v Stoke
West Brom v Norwich
Swansea v Aston Villa
Sunday March 20
Newcastle v Sunderland
Southampton v Liverpool
Man City v Man Utd
Tottenham v Bournemouth
Saturday April 2
Aston Villa v Chelsea
Arsenal v Watford
Bournemouth v Man City
Norwich v Newcastle
Stoke v Swansea
Sunderland v West Brom
West Ham v Crystal Palace
Liverpool v Tottenham
Sunday April 3
Leicester v Southampton
Man Utd v Everton
Saturday April 9
West Ham v Arsenal
Aston Villa v Bournemouth
Crystal Palace v Norwich
Southampton v Newcastle
Swansea v Chelsea
Watford v Everton
Man City v West Brom
Sunday April 10
Sunderland v Leicester
Liverpool v Stoke
Tottenham v Man Utd
Saturday April 16
Norwich v Sunderland
Bournemouth v Liverpool
Everton v Southampton
Man Utd v Aston Villa
Newcastle v Swansea
West Brom v Watford
Chelsea v Man City
Sunday April 17
Leicester v West Ham
Arsenal v Crystal Palace
Monday April 18
Stoke v Tottenham
Saturday April 23
Aston Villa v Southampton
Bournemouth v Chelsea
Crystal Palace v Everton
Liverpool v Newcastle
Norwich v Watford
West Ham v Man Utd
Sunday April 24
Man City v Stoke
Sunderland v Arsenal
Leicester v Swansea
Monday April 25
Tottenham v West Brom
Saturday April 30
Swansea v Liverpool
Everton v Bournemouth
Newcastle v Crystal Palace
Stoke v Sunderland
Watford v Aston Villa
West Brom v West Ham
Arsenal v Norwich
Sunday May 1
Man Utd v Leicester
Southampton v Man City
Monday May 2
Chelsea v Tottenham
Saturday May 7
Aston Villa v Newcastle
Bournemouth v West Brom
Crystal Palace v Stoke
Leicester v Everton
Liverpool v Watford
Man City v Arsenal
Norwich v Man Utd
Sunderland v Chelsea
Tottenham v Southampton
West Ham v Swansea
Sunday May 15
Arsenal v Aston Villa
Chelsea v Leicester
Everton v Norwich
Man Utd v Bournemouth
Newcastle v Tottenham
Southampton v Crystal Palace
Stoke v West Ham
Swansea v Man City
Watford v Sunderland
West Brom v Liverpool
